Releases: JeremyMain/GPUProfiler
GPUProfiler v1.07a3
Release Details
Yet another minor bug-fix release.
V1.07b is still very much alive and being tested, I just wanted to address a few important requests that warrant having another minor release before v1.07b.
#145 : Specified sample interval isn't apply as default
#148 : Removing "Host" (computername) from header of the * .GPD file

New command line parameter "-p" to not collect system identity information
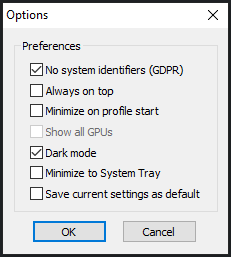
New application option to not collect system identity information and can be saved as a default application option
New tool/feature - GPD2CSV
Convert a single or a group of GPD files with wildcard support to CSV format.
Consider this to be beta quality and please report any issues.
#149 : Create a GPD2CSV batch converter for .GPD files into .CSV files
GPD2CSV
Convert GPUProfiler GPD file(s) to CSV format Version v1.07a2 [6-24-2021]
Usage: gpd2csv [FILE.GPD]       Convert a single GPD file to CSV format
       gpd2csv [FILE*.GPD]      Convert multiple GPD files to CSV format using wildcards
GPUProfiler v1.07a2
Release Details
Bug fix minor release to address the following bugs that impact usability with some GPUs and drivers.
This version adds no new features.
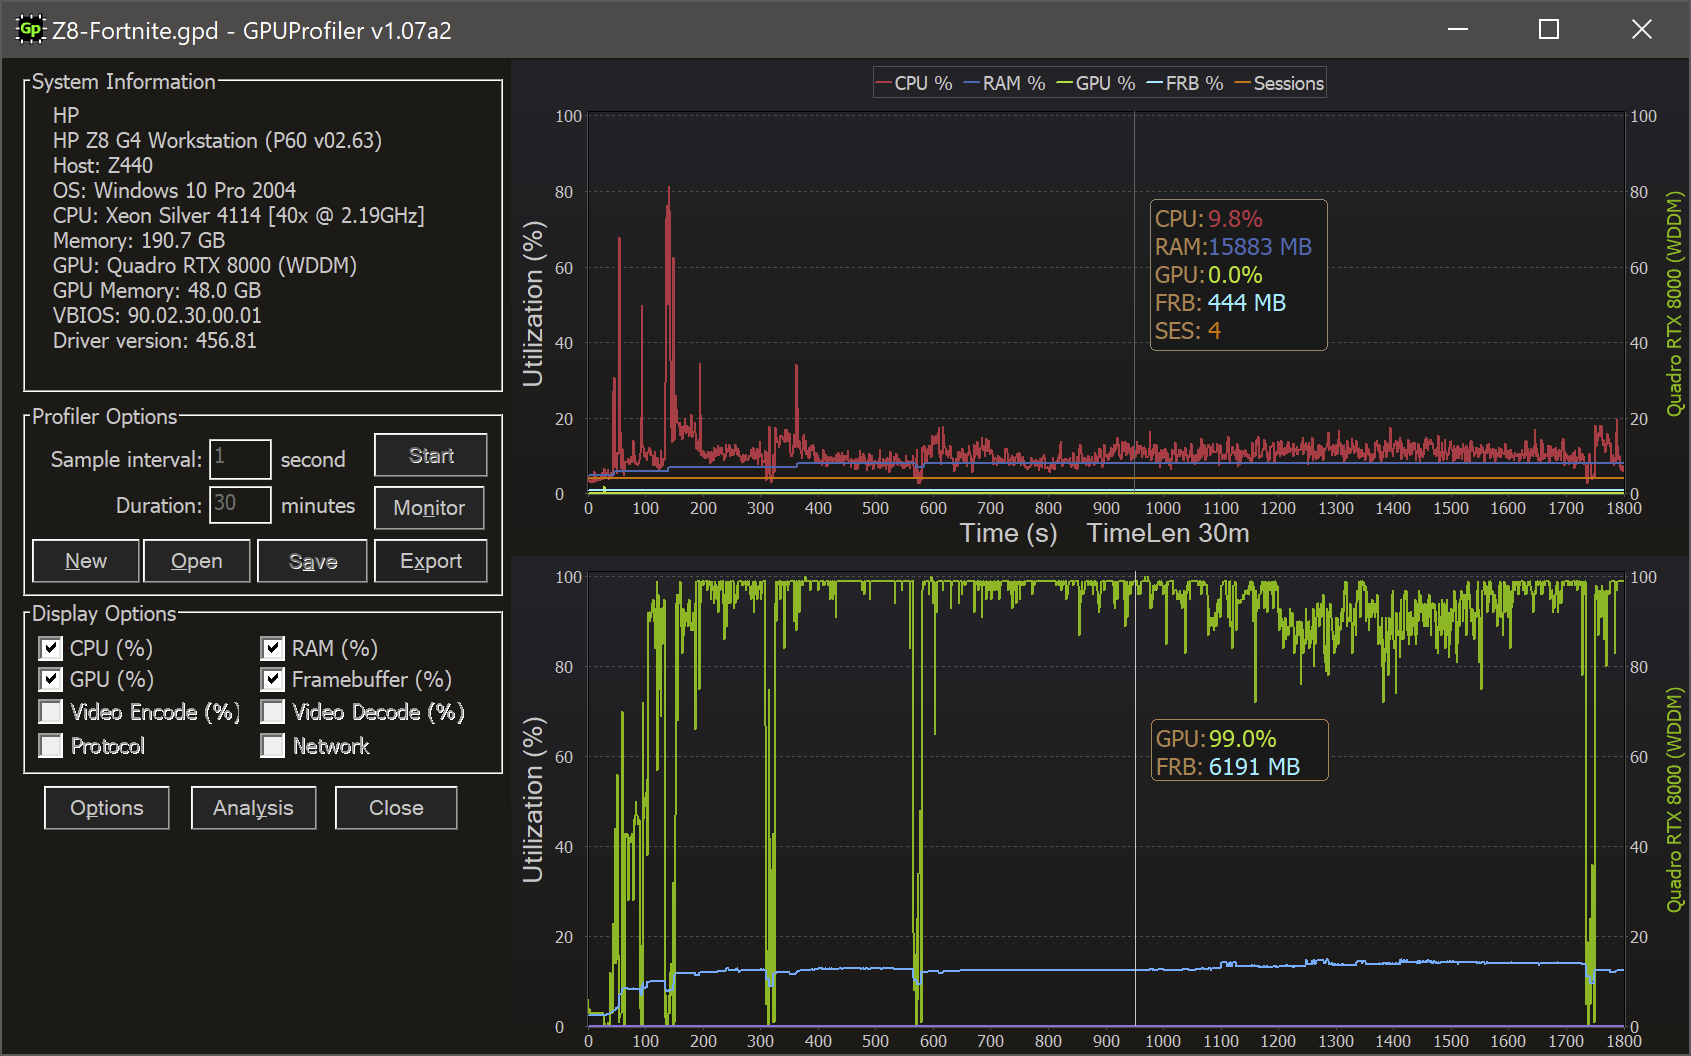
Bug fixes:
- GPU metrics not being displayed, check box is disabled when loading a GPD file #139
- NVML -> NVAPI fallback not working for driver versions < 353.x #140
- Improve DCH driver handling loading NVML library #141
- Protocol FPS Histogram not calculating within the visible protocol range #142
- Time range text and histogram calculations not updated after zoom-full #143
GPUProfiler v1.07a1
Bug fix minor release to address the following bugs that impact usability with some GPUs and drivers.
This version adds no new features.
System memory and GPU memory values are now displayed with one decimal point as rounding made actual memory sizes appear smaller than what is actually available.
Bug fixes:
#122 : DCH Driver fails to detect GPU
#119 : Long GPU description string preventing application execution
GPUProfiler v1.07a

Enhancements:
- When GPUProfiler is running using the command line arguments to automatically collect and save data without user input, if a user logs off of the session or a shutdown event occurs, the collected data will be saved before the session is terminated at the path specified by the command line arguments. (#97 , #114 )
Bugs fixed:
- Opening GPD file from an email attachment fails (#99)
- Spaces in CSV output preceding values (#118)
- Resizing window causes zoomed view to display full (#112)
- Selective display hotkey operations cause zoomed view to display full (#111)
- GPU encode/decode utilization may not be displayed when loaded from a saved file (#116)
GPUProfiler v1.07

New features for this release:
- Multi-GPU support: #103
- Windows Server session count : #94, #83
- Remoting protocol FPS, RTT metrics (with hardware and software encode) : #101
- Citrix HDX
- Teradici PCoIP
- VMware Blast
Enhancements:
#104 : Graph drawing performance
#108 : Multi-GPU and Protocol metrics CSV export
Bugs fixed:
#93 : Exception error while restoring from tray icon during monitoring
#70 : Citrix Client version query failure when running as a XenApp published application
GPUProfiler v1.06a
Bug fix version of v1.06, no new features added.
Corrects the following bugs:
#89 : Process utilization not shown during profiling or monitoring
#90 : Application exception on launch when running on Windows Server 2016
#91 : Exception error while using data inspector within areas not yet containing profile data
#92 : Monitor mode values not correct during scrolling, utilization values are correct
GPUProfiler v1.06
Removed the download module as this release is superseded by the v1.06a release
New features
Continuous monitoring function (fixed 1 second interval, 5 minutes ) #32
Stopping the monitor will allow you to save the data
Enable value/utilization inspector during active profiling or monitoring
Bugs fixed
Incorrect x axis time duration label for intervals > 1 second #86
UI related fixes #87 #82
GPUProfiler v1.05a
Bug fix release

Fixes
- Exception error when loading saved GPD file via explorer file association #68
- Incorrect header in CSV output #69
- Automatic timed series profiling works only on first loop #72
- Automatic timed series profiling, file path handling improvement #73
- Fallback to NVAPI where NVML functionality is limited and restricts accurate utilization metrics (frame buffer reported to be 100% utilized) #74
- Suppress warning dialog(s) when GPUProfiler is run before the driver is loaded after installation (reboot requirement not met) #75
- Process utilization header "FRB" -> "MC" the values returned from NVML include the memory controller utilization and not the Framebuffer utilization #76
- Show the total memory controller utilization in the "_TOTAL" line #76
GPUProfiler v1.05
The latest release of GPUProfiler v1.05 is finally available.
New Features
-
Dark UI theme (light theme can be enabled in options) #50

-
Automated timed series profiling via command line options #55
| Flag | Type | Max Value | Description |
|---|---|---|---|
| -i | int | 60 | Sample interval |
| -d | int | 3660 | Profile duration (in minutes) |
| -r | int | 500 | Repeat (number of times) |
| -f | string | Output path/filename. | |
| -t | Append time stamp | ||
| -m | Minimize during profiling | ||
| -x | Exit on completion |
Example usage:
GPUProfiler.exe -i 1 -d 30 -r 10 -f c:\tmp\profile.gpd -t -m -x
-
Retain user defaults in the registry and load on startup #37 | #38 | #50 | #54
- Default interval, duration, plot bold level as well as the application standard and dash-view window sizes /positions are also saved.
-
Remoting Agent version detection (Citrix / VMware) #25 | #26 | #31
-
GPU WDDM or TCC mode detection #43
-
Display total visible time in X-axis for assisting you visual and logical orientation within the plot.

New Monitoring Capabilities
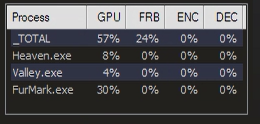
- Per-Process GPU utilization monitoring (currently not serialized in the GPD file, no graph support -yet)
- Maxwell/Pascal generation GPUs for Virtual Machines and workstations (Kepler physical machine support is untested)
- This requires NVIDIA driver version 385.41 or later
Improvements
- Improved DPI scaling support, 100%, 125%, 200% #40
- Default profile view displays the first 60 samples and scrolls from then on #57
- Improved display performance for longer profile runs.
- Two step bolding of the individual plot lines, (third step is to hide it) hotkey ‘g’ for GPU, etc. #22
- Three step bolding of the plot lines (hotkey ‘b’) #41
- Legend display toggle (hotkey 'l') #42
- Dash-view automatically hides legend and Axis labels #42
- Resource utilization histogram update when visible data range changes
- Arrow keys translate within the plot view
- Ctrl+up (zoom in), Ctrl+down (zoom out)
- 4 state 'Home' and 'End' functions
- Zoom all
- Show first / last 50% of total
- Show first / last 25% of total
- Show first / last 13% of total.
- 'Page Up' / 'Page Down' translate along the X-Axis
There are other small changes from v1.04 that I have made, and as with all new releases, there are corner cases that I have not completely tested and would appreciate any discovered bugs to be added to the page.
New feature requests can be added and tracked there as well.
GPUProfiler v1.04
I have completed implementing and testing all of the new enhancements to the 1.04 release of GPUProfiler.

A short list of changes from v1.03 -> 1.04
- In-graph display of utilization data in percentage or actual value for loaded files and for post collection results
- Scroll, pan and zoom support via mouse wheel.
- Re-sizable windows, size retained for each mode (normal/dashboard)
- Dashboard mode via double clicking on the graph (revert to prior view via same method)


- Resource histogram analysis analyzes the current visible time range (zoom in to examine a particular operation’s resource utilization)
- Improvement in histogram calculation and handling of 100% and 0% values.
- Histogram width increased to give better visibility
- Selective display of histogram data based on current data display options
- Double clicking each histogram toggles between auto-scale and fixed scale mode
-- Fixed scale

-- Automatic scale

- Keyboard accelerators to show/hide the graph data in the plot, data tooltip and the histogram:

-- 'C' - CPU
-- 'R' - RAM
-- 'G' - GPU
-- 'F' - Framebuffer
-- 'E' - Video Encoder
-- 'D' - Video Decoder - The Analysis (histogram) can be shown or hidden with
-- 'A' - Analysis - When data is loaded these hotkey control the display of utilization information when the mouse is within the graph results:
-- 'U' - Utilization
-- 'V' - Values (and utilization where appropriate) - Dependencies have been statically linked to remove the prior requirement to install Visual Studio redistributables
- ‘GPD’ file associations are set on startup based on current executable path, GPD file icon added as well.

- Zoom full to profile overview when profile collection has been completed
- Removed checks that prevented the application from running in environments without NVML or an NVIDIA GPU
- Improved scrolling/panning during profiling when in a zoomed view state
- Multi GPU collection and support in the GPD data file but no current display in the UI
- Added a disclaimer for my employer (thank you Rachel) in the about box
- Font improvements to handle large DPI display users
